Welcome to the Iowa Water Quality Information System. IWQIS allows access to real-time water quality data and information, such as nitrate, pH, dissolved oxygen concentrations, discharge rates, and temperature.
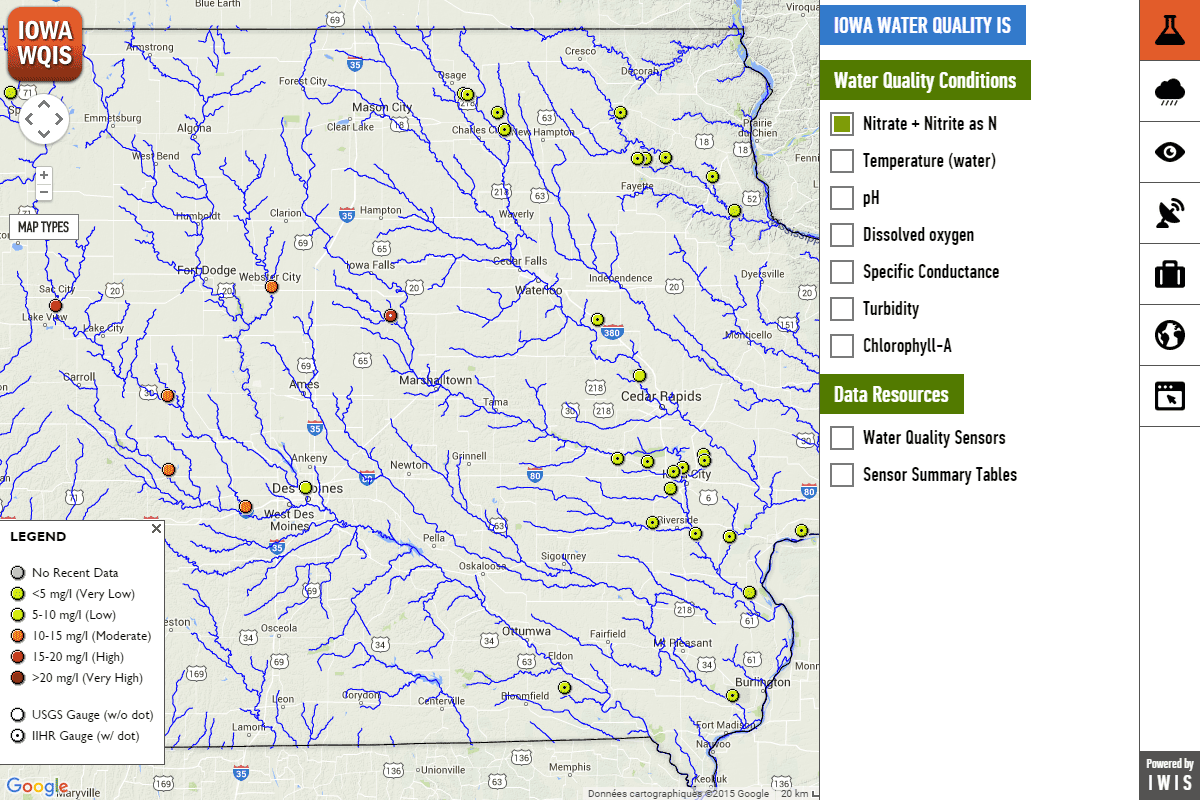
Water Quality Conditions
Real-time water conditions
Water Quality Quick View
Quick view of nitrate evolution over the last few days

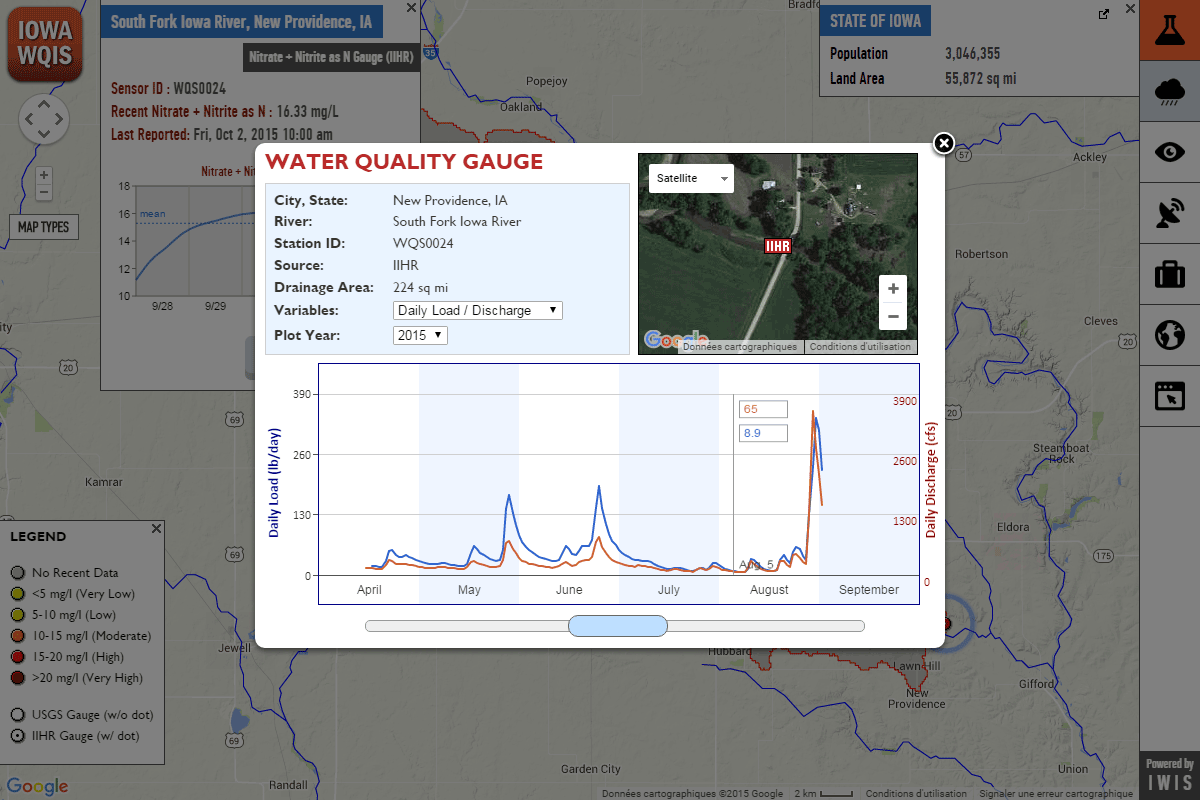
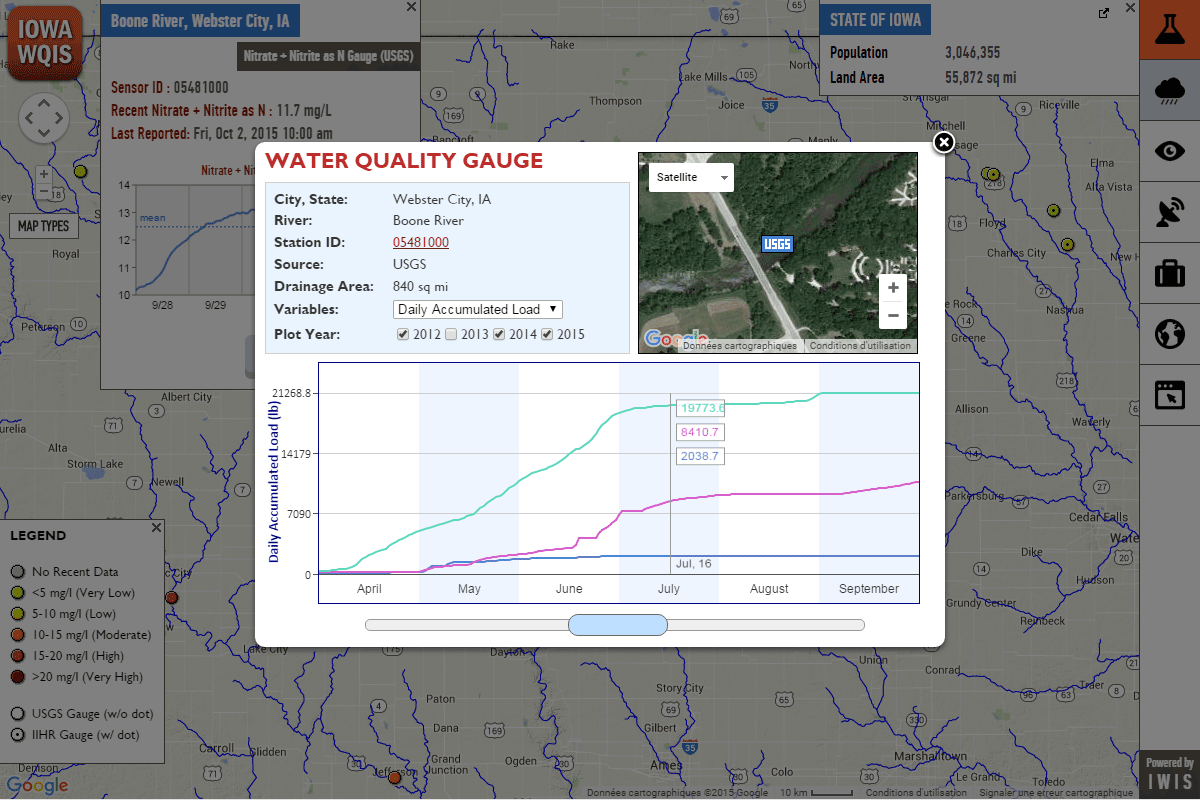
Water Quality Annual View
Multi-variable plot or multi-year data comparison
Water Quality Detailed View
Water quality–related variables, such as water temperature, pH, dissolved oxygen, and more over the last 15 days


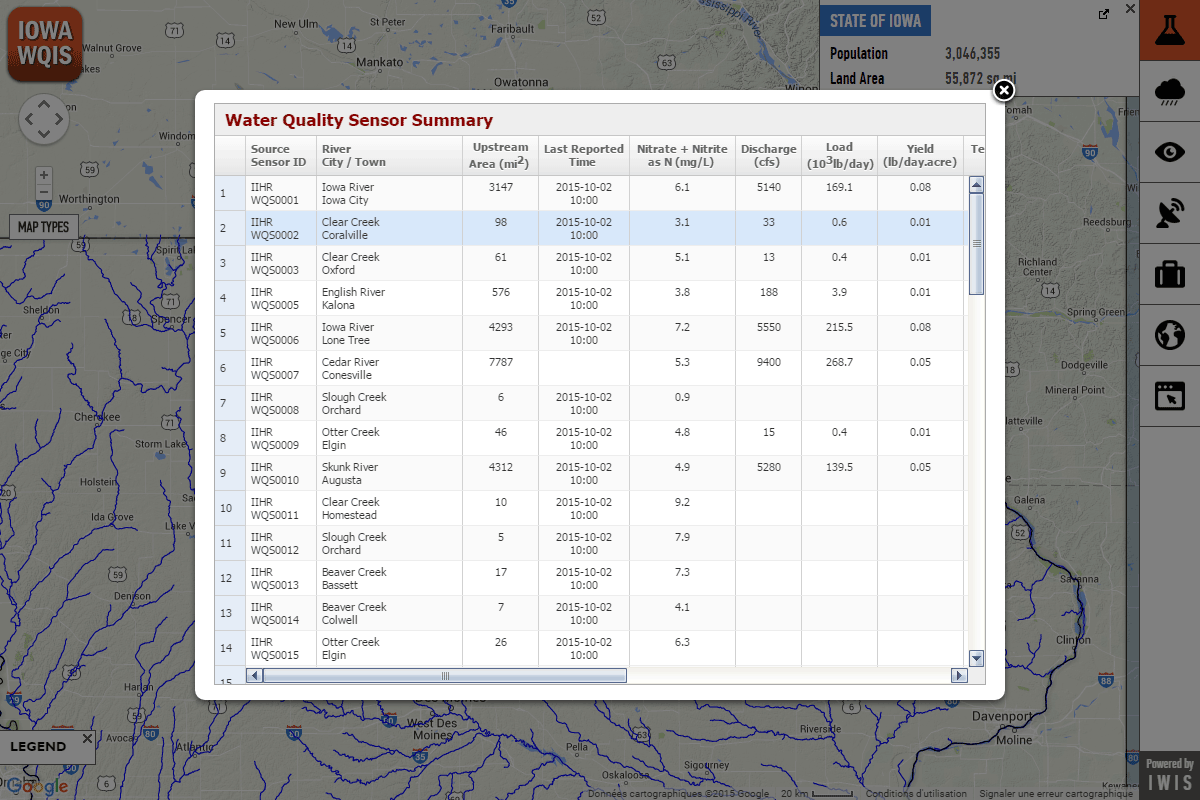
Water Quality Summary Table
Tabulated view of the latest measurements of quality-related parameters at every site, including water temperature, pH, dissolved oxygen, and more
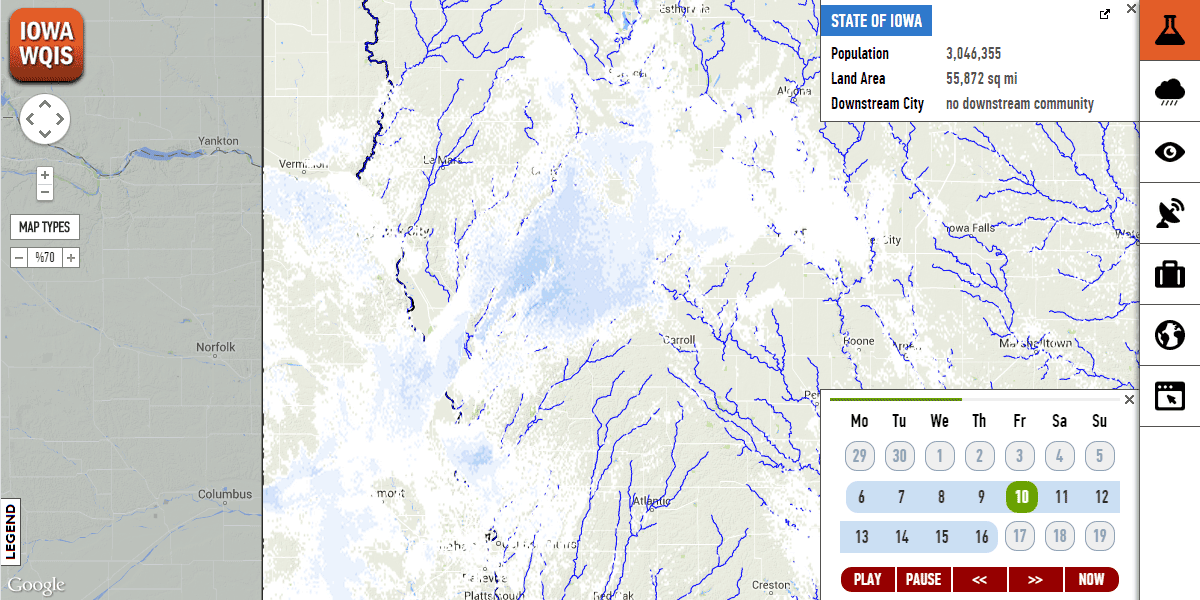
Weather Conditions
Real-time rainfall maps displaying current conditions, and past rainfall accumulation. Rainfall products are supported by National Science Foundation (NSF) under grants 0427422 (ATM) and 0839576 (GEO).

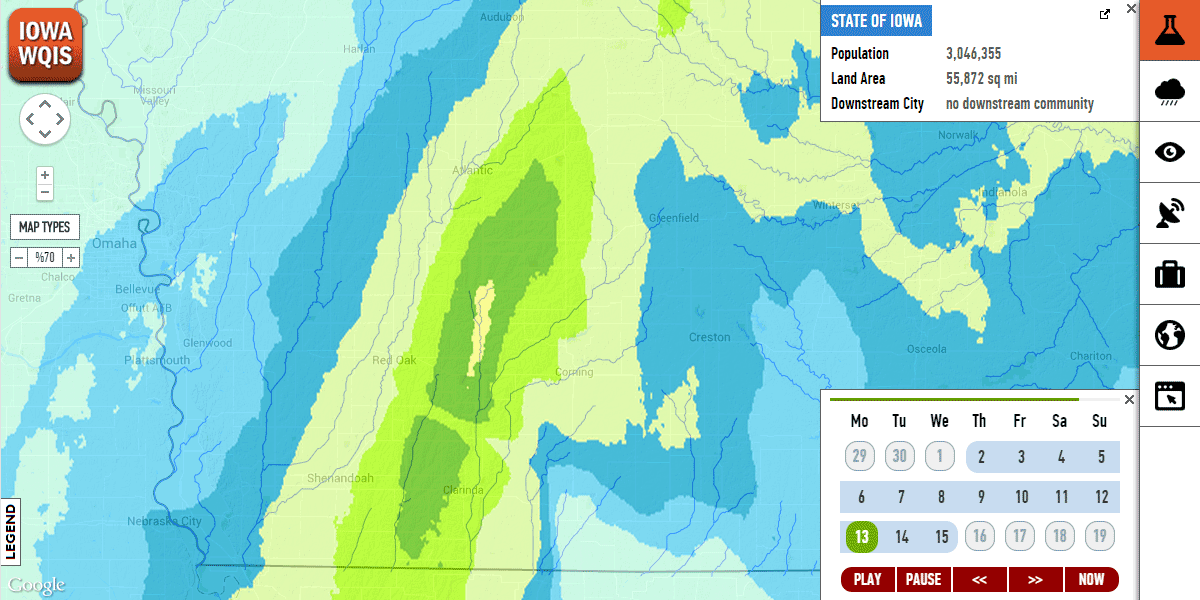
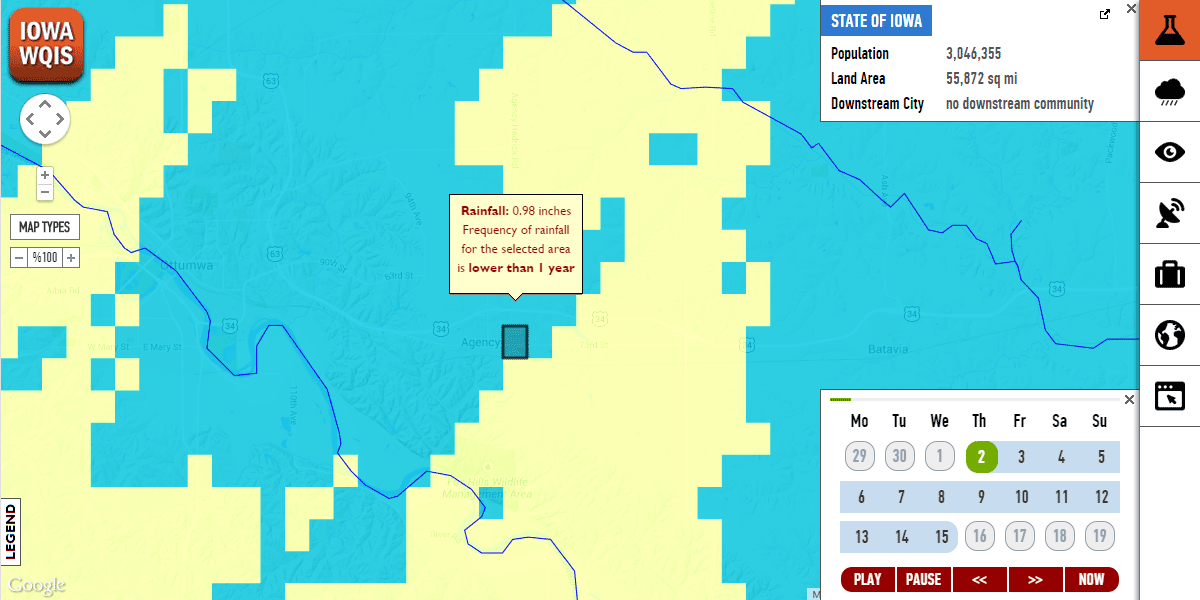
Rainfall Frequency Maps
Compare daily rainfall accumulation with frequency in real-time (utilizing WebGL).
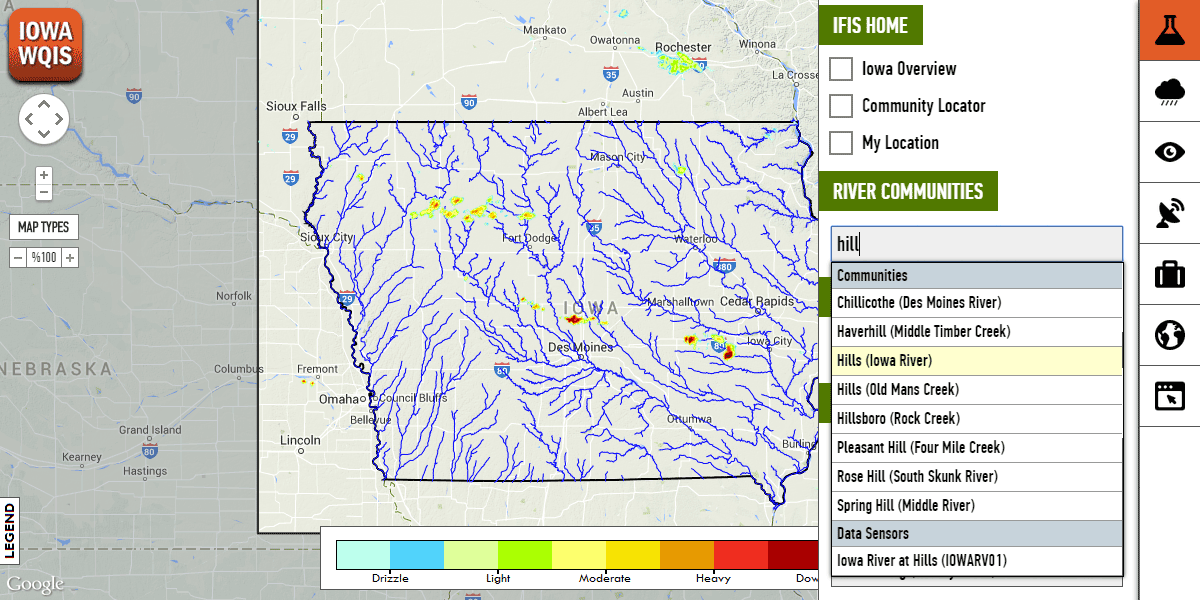
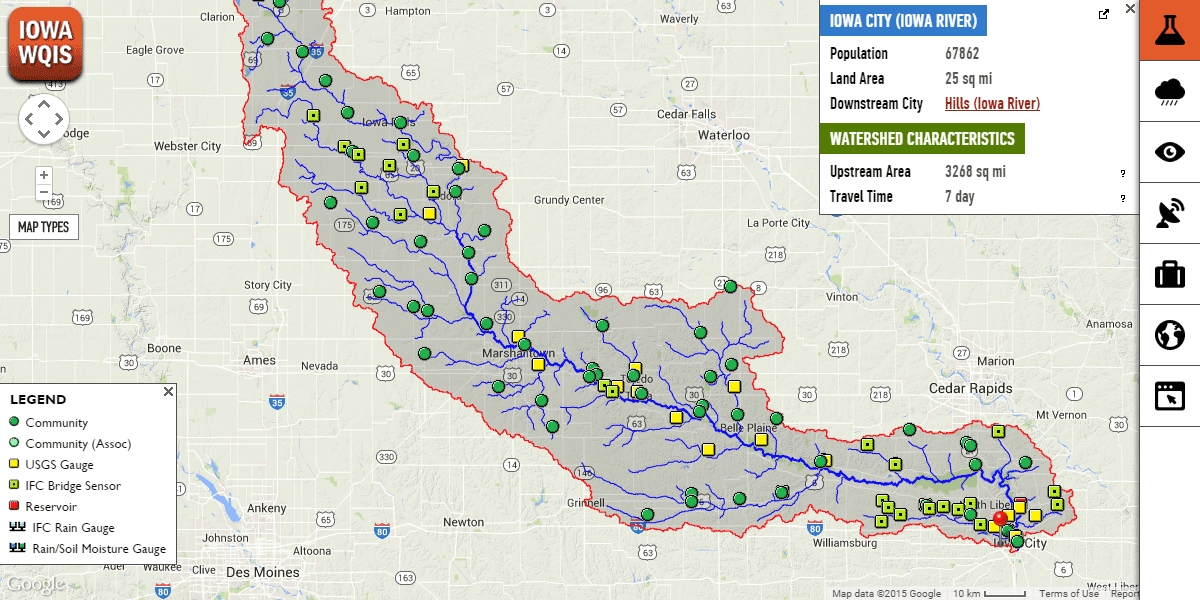
My Community — My Watershed
Community-based nutrient conditions, data resources, and upstream watershed characteristics
Daily Snow Melt
Hourly snow melt for Iowa for the last 11 days
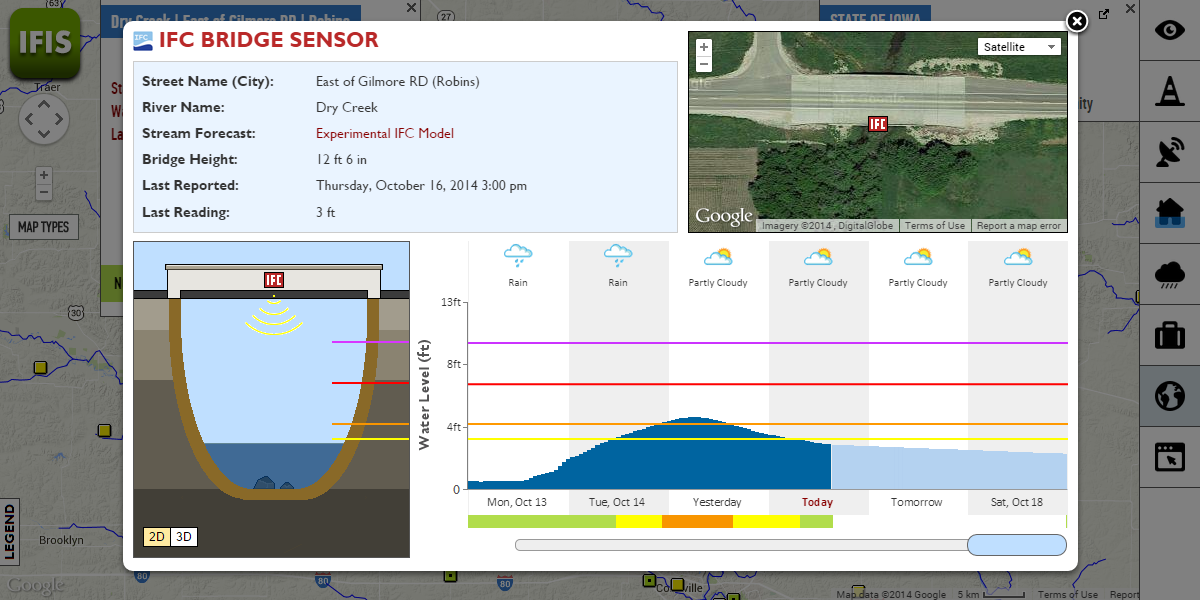
Interactive Visualizations
Visualizations of water levels and stream gauge readings with 3D/2D interactive animations
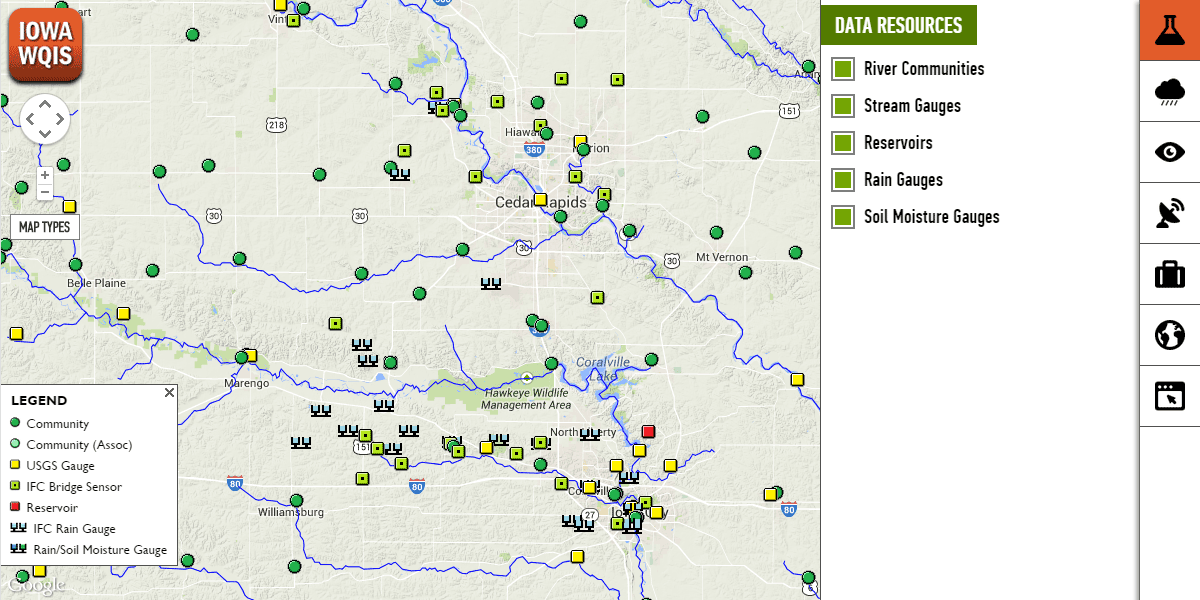
IWQIS Data Resources
Data from IFC’s stream sensors, rain gauges, and data sources, displaying real-time and historical information
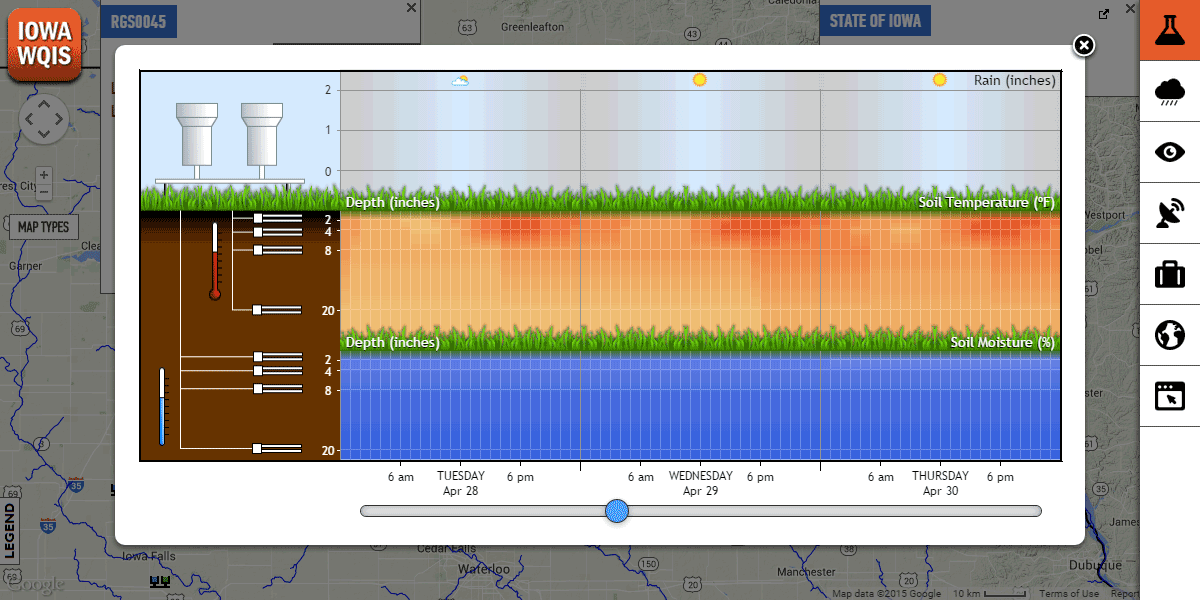
Soil Moisture Data Visualizations
Data from rain and soil moisture gauges visualized in a custom interface
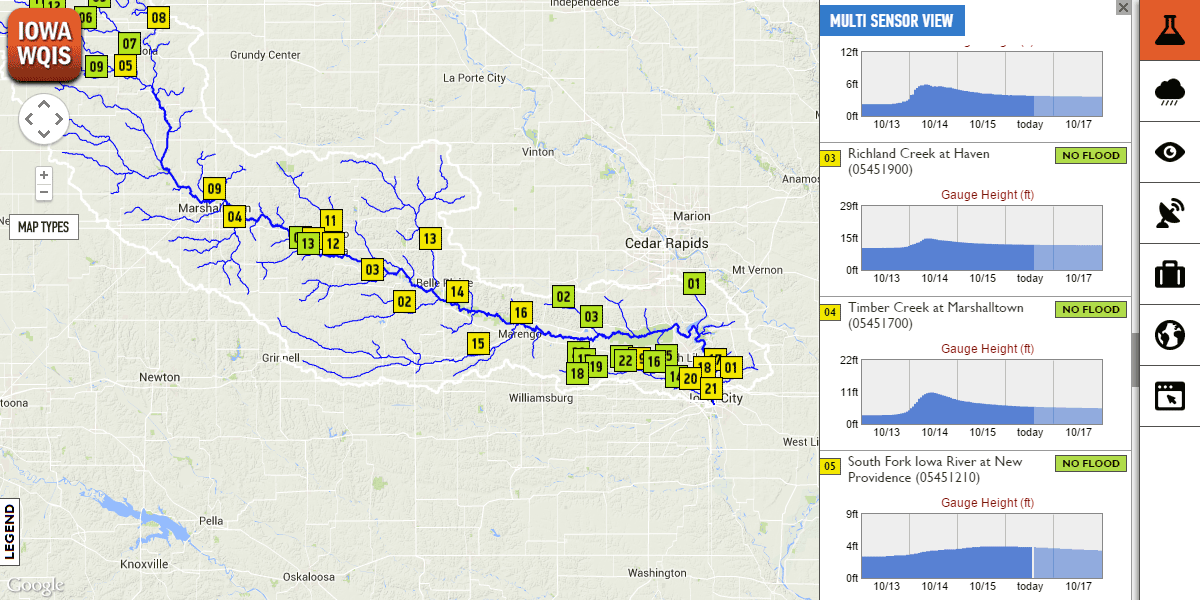
River View
Visualization of data from multiple IFC stream sensors and USGS gages in a single view along a river
Rainfall Tracker
See how rainfall moves in the river network — click anywhere on the map to see rain draining in the river network.

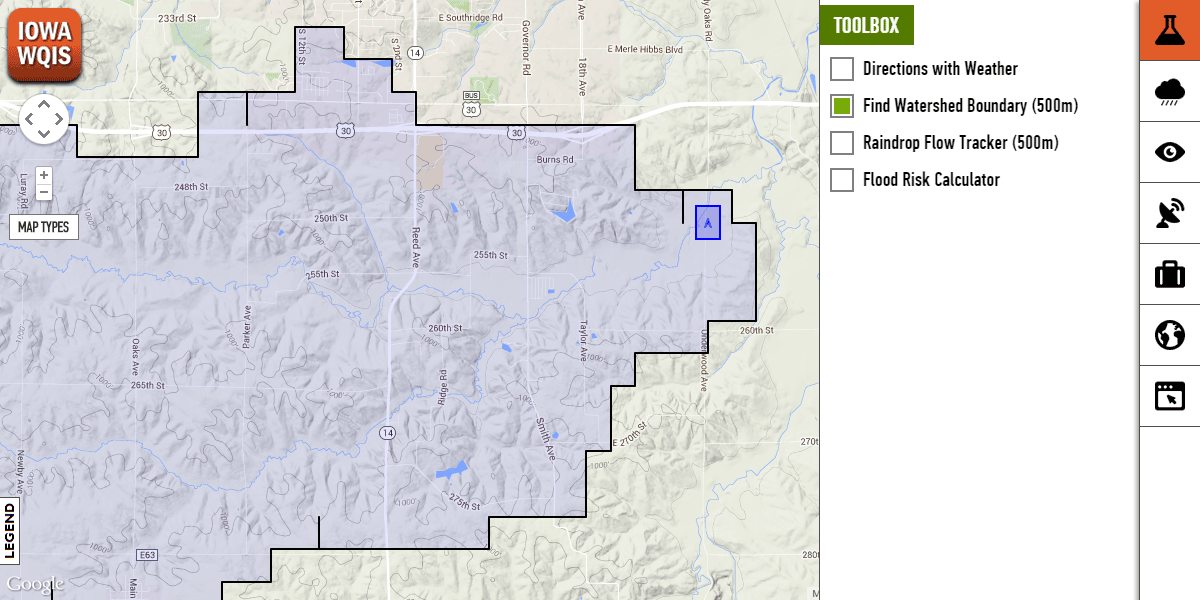
Watershed Delineation Tool
Click anywhere on the map and generate a view of the watershed boundaries instantly.
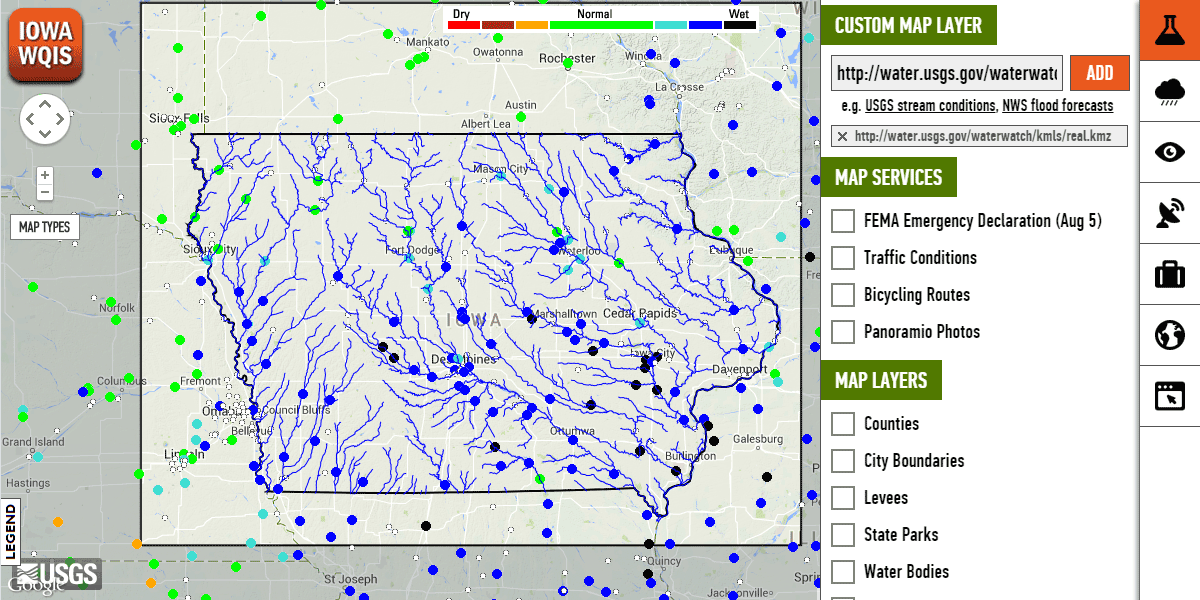
Custom Map Layer
Add any map layer on IWQIS using KML, KMZ, or GeoRSS formats.
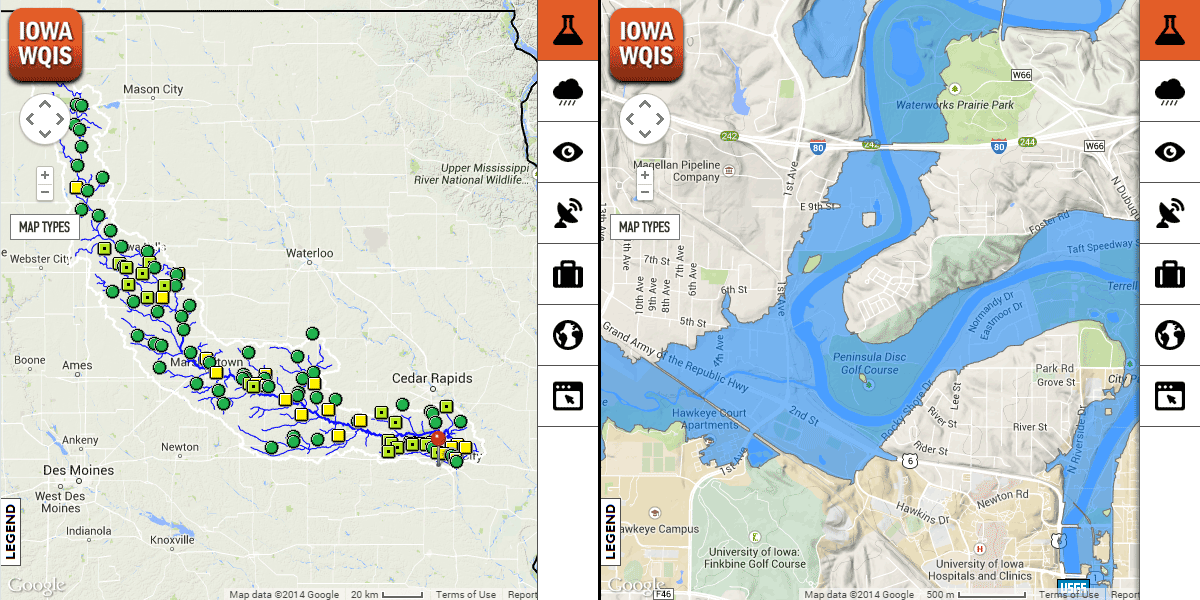
Split Map View
The split map view in IWQIS allows you to compare features and data resources for two locations on the map.